
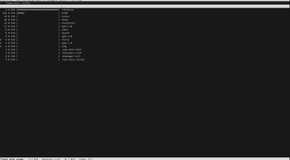
1NCurses Disk Usage (ncdu)
To view the sizes of directories, du is a solid choice, and it's generally the first pick for most people. However, it lacks exploratory capabilities. A few times a year, my system complains to me that it's running low on disk space, and I find myself exploring the file system to manually delete large directories of accumulated garbage. This is where du lacks, and where ncdu shines.
With its simple interface, ncdu provides blazing-fast exploration to size up directories.


Ncdu may be found in the majority of official distribution repositories.
To install it on Debian and its derivatives, e.g., Ubuntu, Linux Mint, etc.:
sudo apt-get install ncdu
To install it on Red Hat and its derivatives, e.g., Fedora:
sudo dnf install ncdu
To install it on Arch and its derivatives:
sudo pacman -S ncdu
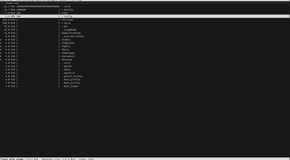
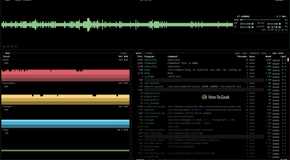
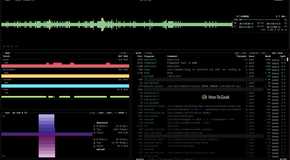
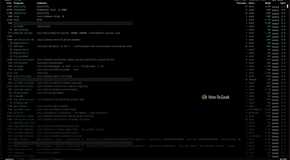
2Btop++
Because it provides a broad overview of my entire system, Btop is easily one of my favorite utilities. It displays bars and charts for CPU, disk, memory, and network utilization. Additionally, the "processes" pane has a top-like interface that allows you to filter and kill individual processes.
To filter processes, press the F key, and to kill the highlighted process, press K.


In addition to that, you can enable or disable any pane by pressing a single key. Btop makes it simple to quickly change views over your system's resources.


The fun does not stop there, because there are (again) Vim keys for those who feel lost without them.

It's available via most native distribution repositories. For some, it's available in the respective extra repositories. For everyone else, you can install it via Brew or Snap.
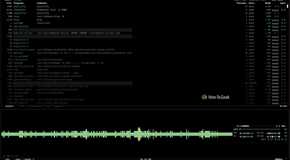
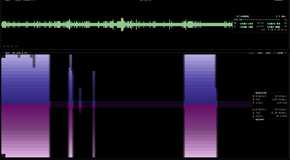
3Bandwhich
Bandwhich is a real-time network monitor that displays live network connections. It differs from netstat because it focuses on active connections in real time. It differs from tcpdump because it's not an endless stream of packets.
sudo bandwhich

sudo bandwhich --total-utilization # Or -t

I prefer Bandwhich over other tools, like tcpdump, because it's straightforward and convenient, making it possible to quickly identify which processes are contacting the network.
It's available via the Arch, Nix, Void, and Fedora (Copr) repositories; for everyone else, you can install it via Snap, Cargo, or directly via GitHub releases.
To install it on Debian and its derivatives (e.g., Ubuntu or Mint):
sudo apt-get install ncdu
To install it on Red Hat and its derivatives (e.g., Fedora):
sudo dnf copr enable atim/bandwhich -y
sudo dnf install bandwhich
The Fedora packages are promptly updated. The packages for other RHEL distributions lag behind, and you may find that your distribution release is not yet supported.
To install it on Arch and its derivatives:
sudo pacman -S bandwhich
cargo install bandwhich
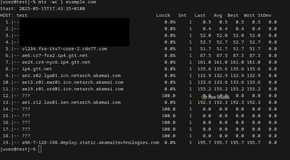
4My Traceroute (mtr)
The MTR command is like a live version of tracepath. Tracepath will ping each network hop sequentially a fixed number of times; MTR will ping every network hop concurrently until stopped. It displays real-time statistics for packet loss, jitter, and latency in a live curses interface.
mtr example.com

Routers often deprioritize ICMP packets, so it's common to see high packet loss for some hops. Also note that these hops are more likely to throttle ICMP if you're connecting via a VPN, but it does not mean that you have a connection issue; it just means that you have an ICMP issue. Switching to TCP (-T) or UDP (-u) rarely helps in these cases.
mtr -wc 1 example.com # Wide report; 1 probe.
mtr -jc 1 example.com # JSON report; 1 probe.


The available options are plenty, but a picture is worth a thousand words.

MTR has been around for decades, and it's available in every distribution repository.

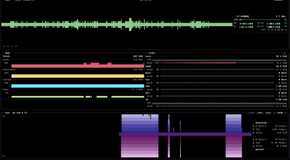
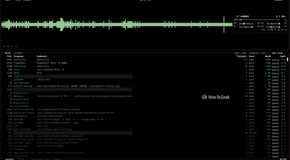
5Bandwidth Monitor (bmon)
bmon m
bmon -p 'eth*' # Listen to all hardwired interfaces.
You can see all of your interfaces with ifconfig.

It's true that Btop++ also provides real-time bandwidth visualizations, but bmon provides some additional network statistics. With bmon open, press D or i, and it will open additional panes with extra context.

One of bmon's best features is that it's scriptable. Specific output fields can be defined, formatted, and then processed further using other tools or scripts.
bmon -p 'eth*' -o format:fmt='$(element:name) $(attr:rx:bytes) $(attr:tx:bytes) $(attr:rx:errors)\n'

To see the formatting rules, use the following command:
bmon -o format:help
Bmon has been around for a while, and it's available in most official distribution repositories.
These tools cannot replace their standard GNU/Linux counterparts; they only address specific gaps. A lot of the standard utilities do not have live, real-time monitoring capabilities, and often we just want to see how our systems change over time. For example:
- Tcpdump emits a deluge of text; I just want to see what's connecting to the network.
- Du was never designed with "search and destroy" in mind—unlike its dd brethren.
Although the listed tools address very specific needs, they do not address all needs—for that, you will need to keep digging.
Comments
Post a Comment